Dashboard
Comprehensive financial overview with widgets, charts, and transaction monitoring
Introduction
The LYNKS Dashboard provides a comprehensive financial overview through customizable widgets displaying real-time information about accounts, payments, counterparties, and cashflow. Designed to meet the needs of different user types, the Dashboard enables top management to monitor cash positions and make informed financial decisions, while accountants can quickly review daily payment activities and manage liquidity.
The Dashboard presents aggregated financial data with intelligent currency conversion using European Central Bank (ECB) exchange rates, allowing users to view consolidated positions across multiple currencies. The interface adapts to each user's role and permissions, displaying only information relevant to their responsibilities and accessible accounts.
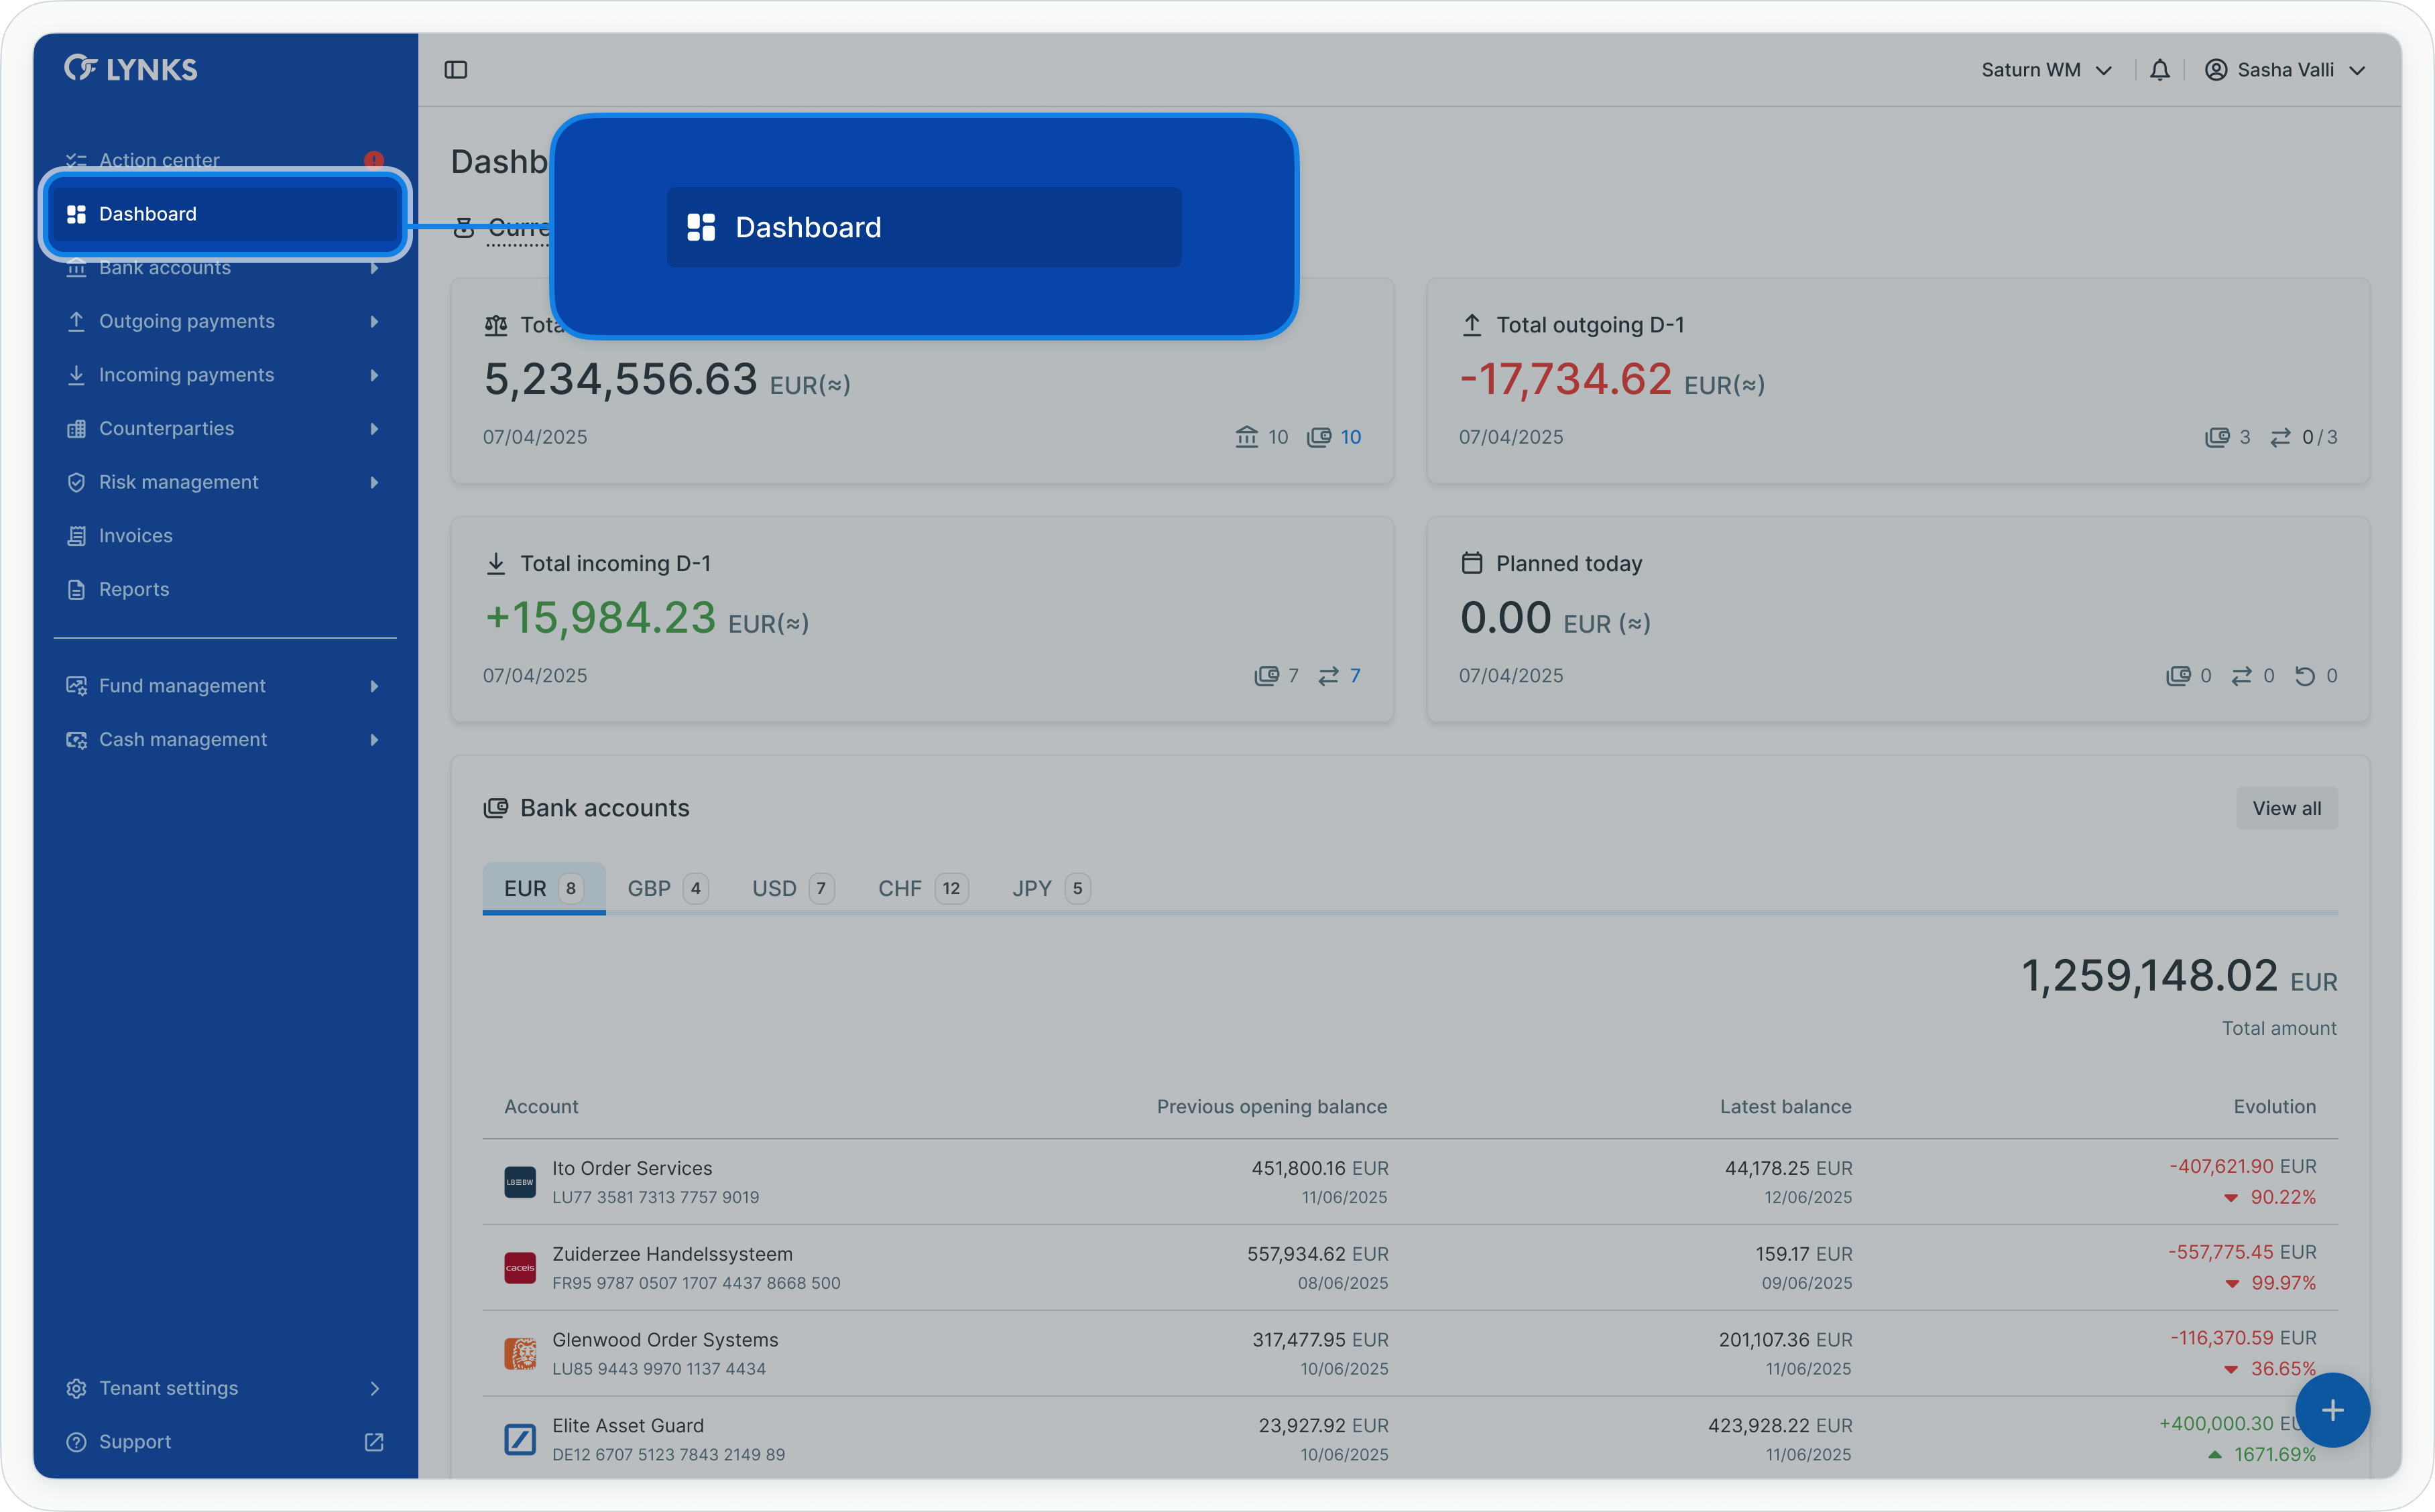
Dashboard menu navigation
Dashboard overview
Prerequisites
Users must have the appropriate permissions to view Dashboard widgets. Each widget displays data based on your access rights to specific accounts, payment categories, and counterparties.
Permissions
| Permission | Description |
|---|---|
DASHBOARD_READ | View the Dashboard and access widgets |
ORDERING_PARTY_BALANCE_READ | View account balances and balance evolution |
PAYMENT_READ | View credit transfer widgets and payment status counters |
COUNTERPARTY_ACCOUNT_READ | View counterparty status widgets |
Scoped permissionsDashboard widgets respect account, category, and counterparty scoping defined in your permissions. You see only data for resources you have access to.
Dashboard overview
The Dashboard organizes financial information into distinct widgets, each focusing on a specific aspect of your treasury operations. Users can customize their view by applying filters to focus on specific accounts or account groups.
Accessing the dashboard
The Dashboard is accessible from the main navigation menu in LYNKS, providing immediate access to your financial overview.
Navigation
To access the Dashboard:
- Locate the main navigation menu on the left side of the LYNKS interface
- Click on Dashboard to open the financial overview
- The interface displays all widgets based on your permissions and accessible accounts
The Dashboard automatically refreshes to display current data and updates widgets as new information becomes available.
Using dashboard filters
The Dashboard provides global filtering capabilities enabling you to focus your view on specific accounts or account groups, refining all widgets simultaneously to display only relevant data.
Applying account filters
To filter Dashboard information by account:
- Locate the filter controls at the top of the Dashboard interface
- Click the account selector dropdown
- Choose from the available options:
- All accounts - Display data for all accessible accounts (default)
- Specific account group - Filter to show only accounts within a defined group
- Individual account - Focus on a single ordering party account
- The Dashboard refreshes automatically to display filtered data
All widgets update simultaneously to reflect your filter selection, providing a consistent focused view across the entire Dashboard.
Clearing filters
To return to the complete view:
- Click the account selector dropdown
- Select All accounts to remove filtering
- All widgets refresh to display comprehensive data
Filter persistenceYour Dashboard filter selection persists during your session, maintaining your focused view as you navigate to other pages and return to the Dashboard.
Interacting with dashboard widgets
Dashboard widgets provide interactive elements enabling you to navigate directly to detailed views and access additional information about displayed data.
Clicking widget counters
Most widgets include clickable status counters that redirect to filtered list views:
- Identify the counter showing the metric of interest (e.g., "12 Waiting for signature(s)" in the Credit transfers widget)
- Click the counter to navigate to a pre-filtered list view showing only items matching that status
- Review details and take action on the filtered items
- Use the browser back button or navigation menu to return to the Dashboard
Using view all buttons
Widgets include View all buttons for accessing complete list views without pre-applied filters:
- Locate the View all button typically positioned at the bottom of a widget
- Click to redirect to the corresponding section (e.g., Bank Accounts, Credit Transfers, Counterparties)
- The destination page displays all items without status-based filtering
Interacting with charts
Chart widgets provide interactive elements for detailed analysis:
Bar charts (Overdue credit transfers)
- Hover over any bar to display tooltip information showing date, amounts, and transaction counts
- Click a bar to navigate to a pre-filtered list showing payments overdue for that specific date
Line graphs (Balance evolution)
- Hover over data points to view specific balance amounts and dates
- Click account cards to navigate to detailed account views
Cashflow evolution chart
- Hover over bars to display detailed incoming, outgoing, and balance information for each date
- Use the account selector dropdown in the widget header to change the displayed account
- Observe historical data (left of black line) and forecasted data (right of black line)
Customizing time ranges
Widgets displaying time-based data provide time range selectors enabling you to adjust the period shown in charts and analyze trends over different durations.
Changing time range
To adjust the time range for widgets with date-based data:
- Locate the time range selector typically positioned in the widget header (e.g., "Last 7 days", "Last 30 days")
- Click the selector to open the dropdown menu
- Choose your desired time period from the available options:
- Last 3 days
- Last 7 days
- Last 15 days
- Last 30 days
- The chart refreshes automatically to display data for the selected period
Changing cashflow account
The Cashflow evolution widget includes an account selector for viewing different ordering party accounts:
- Locate the account selector dropdown in the top right corner of the Cashflow evolution widget
- Click the dropdown to display all accessible ordering party accounts
- Select the account you want to analyze
- The chart updates to show historical and forecasted cashflow for the selected account
The widget defaults to displaying your most frequently used account based on transaction volume over the last 7 days.
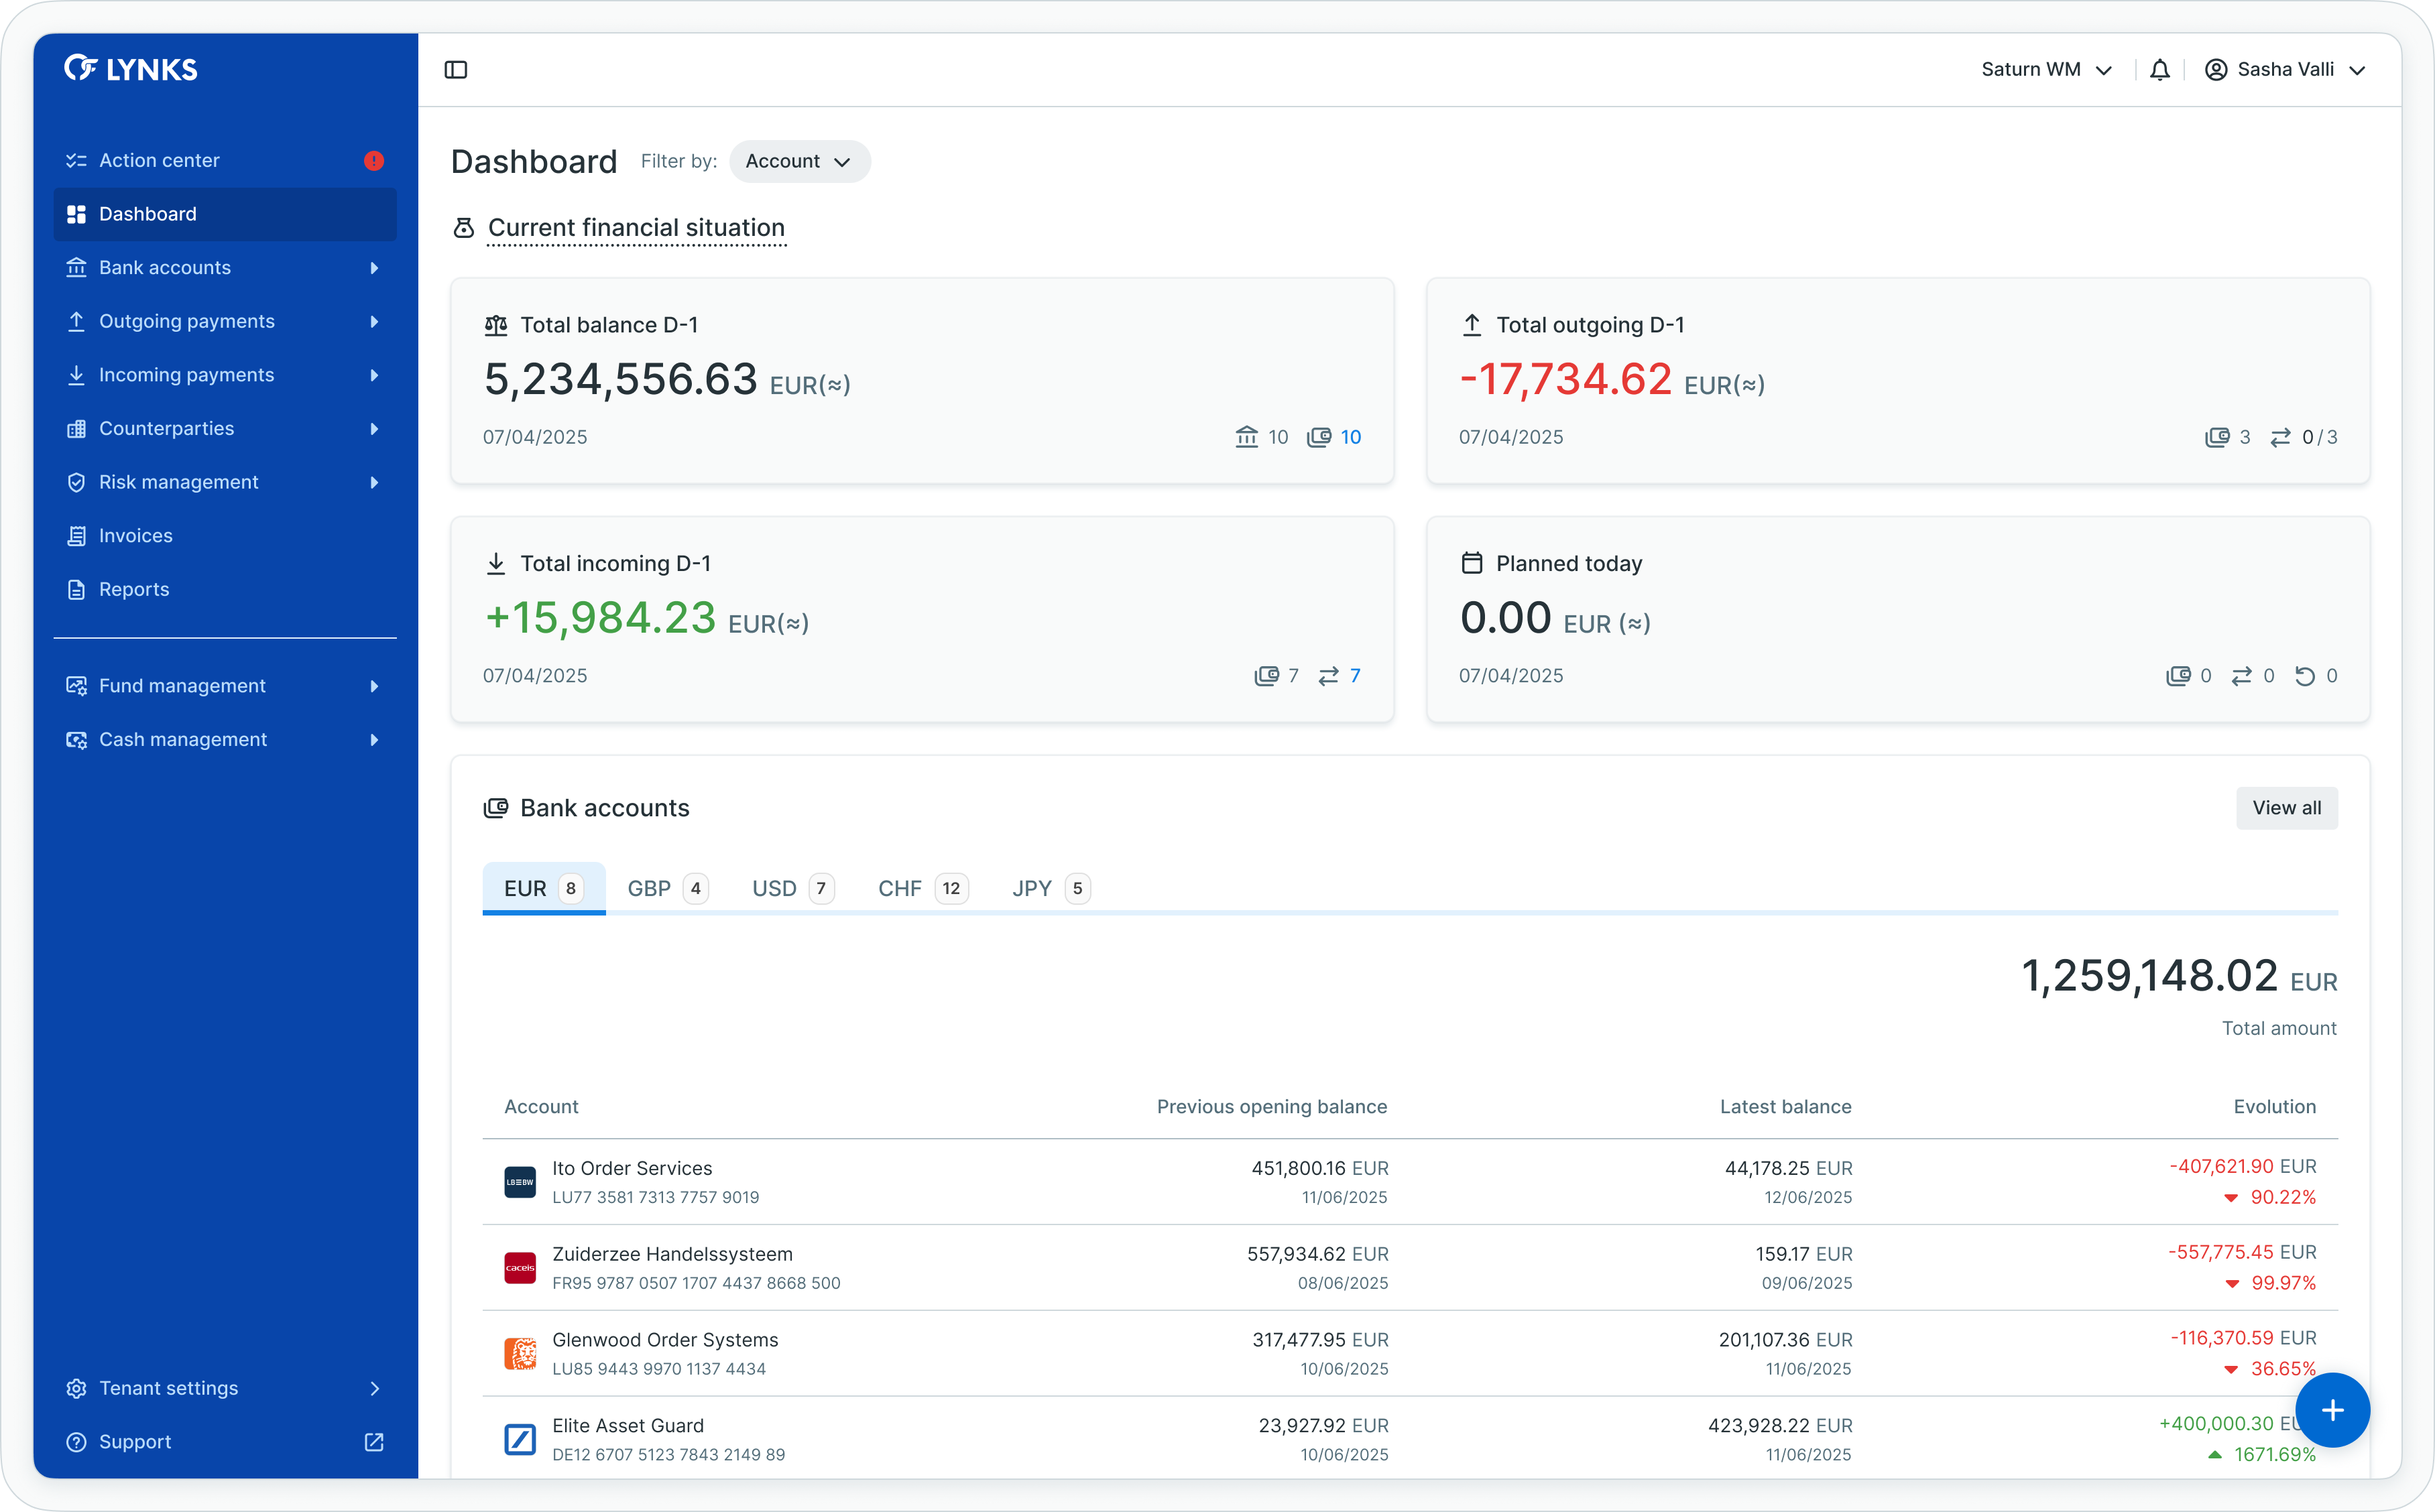
Current financial situation
Four dedicated widgets display key financial metrics providing an at-a-glance view of your current financial position. All amounts reflect aggregated balances with applied ECB exchange rates, indicated by the symbol (≈) following the currency.
Current financial situation widgets
| Widget | Description |
|---|---|
| Total balance D-1 | Aggregated closing balance from the previous day across all accessible accounts with applied exchange rates |
| Total outgoing D-1 | Aggregated amount of executed payments from the previous day |
| Total incoming D-1 | Aggregated amount of received payments from the previous day |
| Planned today | Forecasted amount of today's planned payments already signed and pending transfer or delivery to the bank |
Each widget displays small icons indicating the number of banks, ordering party accounts, credit transfers, and standing orders included in the calculation.
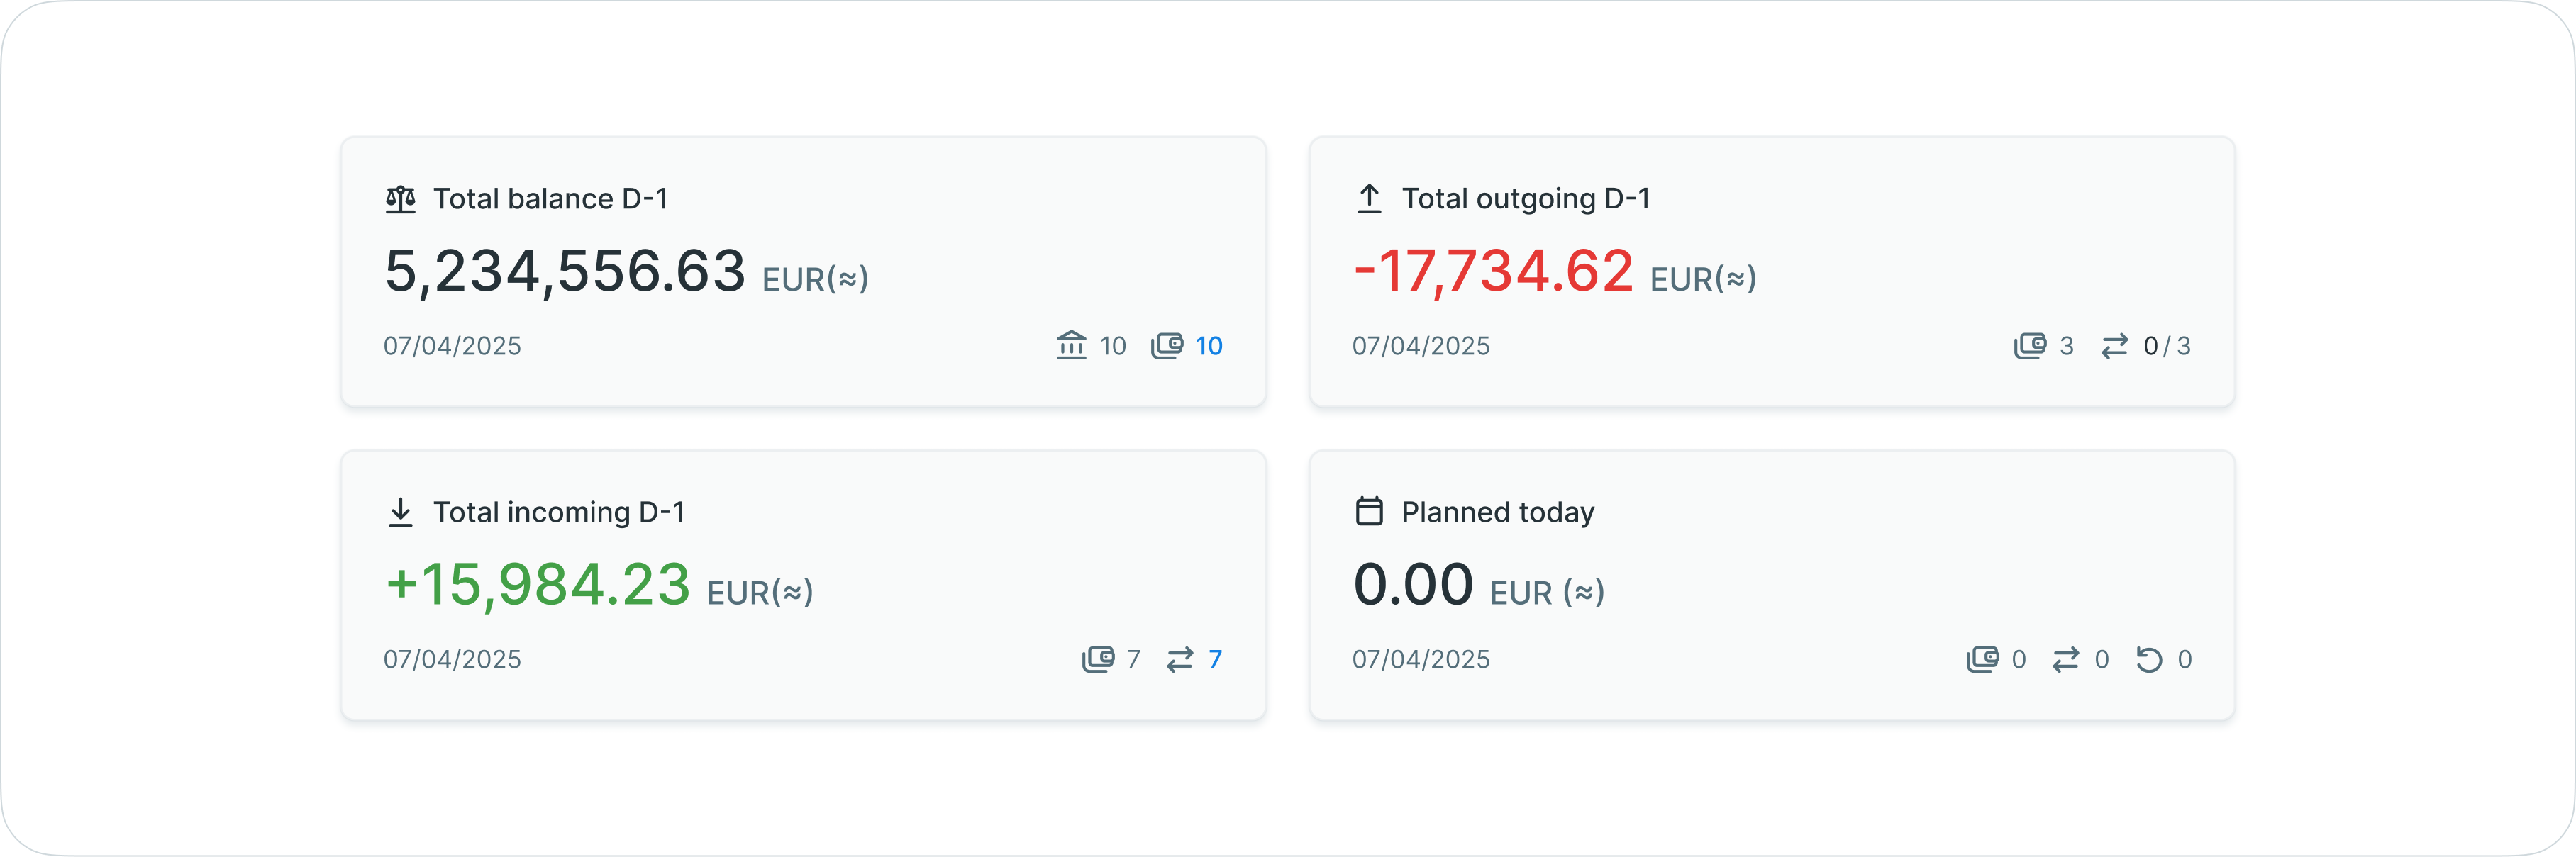
Bank accounts widget
The bank accounts widget displays an overview of all accessible accounts organized by currency, showing opening balances, closing balances, and balance evolution graphs.
Bank accounts widget
Account information displayed
For each currency grouping, the widget shows:
- Previous opening balance
- Latest closing balance
- Visual graph showing balance evolution over time
- Quick navigation to account details
The View all button redirects to the Bank Accounts page for detailed account management.
Related functionalityFor detailed account information, balance monitoring, and transaction history, see Bank Accounts - Account management, balance monitoring, and transaction history.
Credit transfers widget
The credit transfers widget provides an overview of payment status across the platform, displaying counters for each transaction state. A yellow icon indicates when at least one payment is destined for a counterparty awaiting approval.
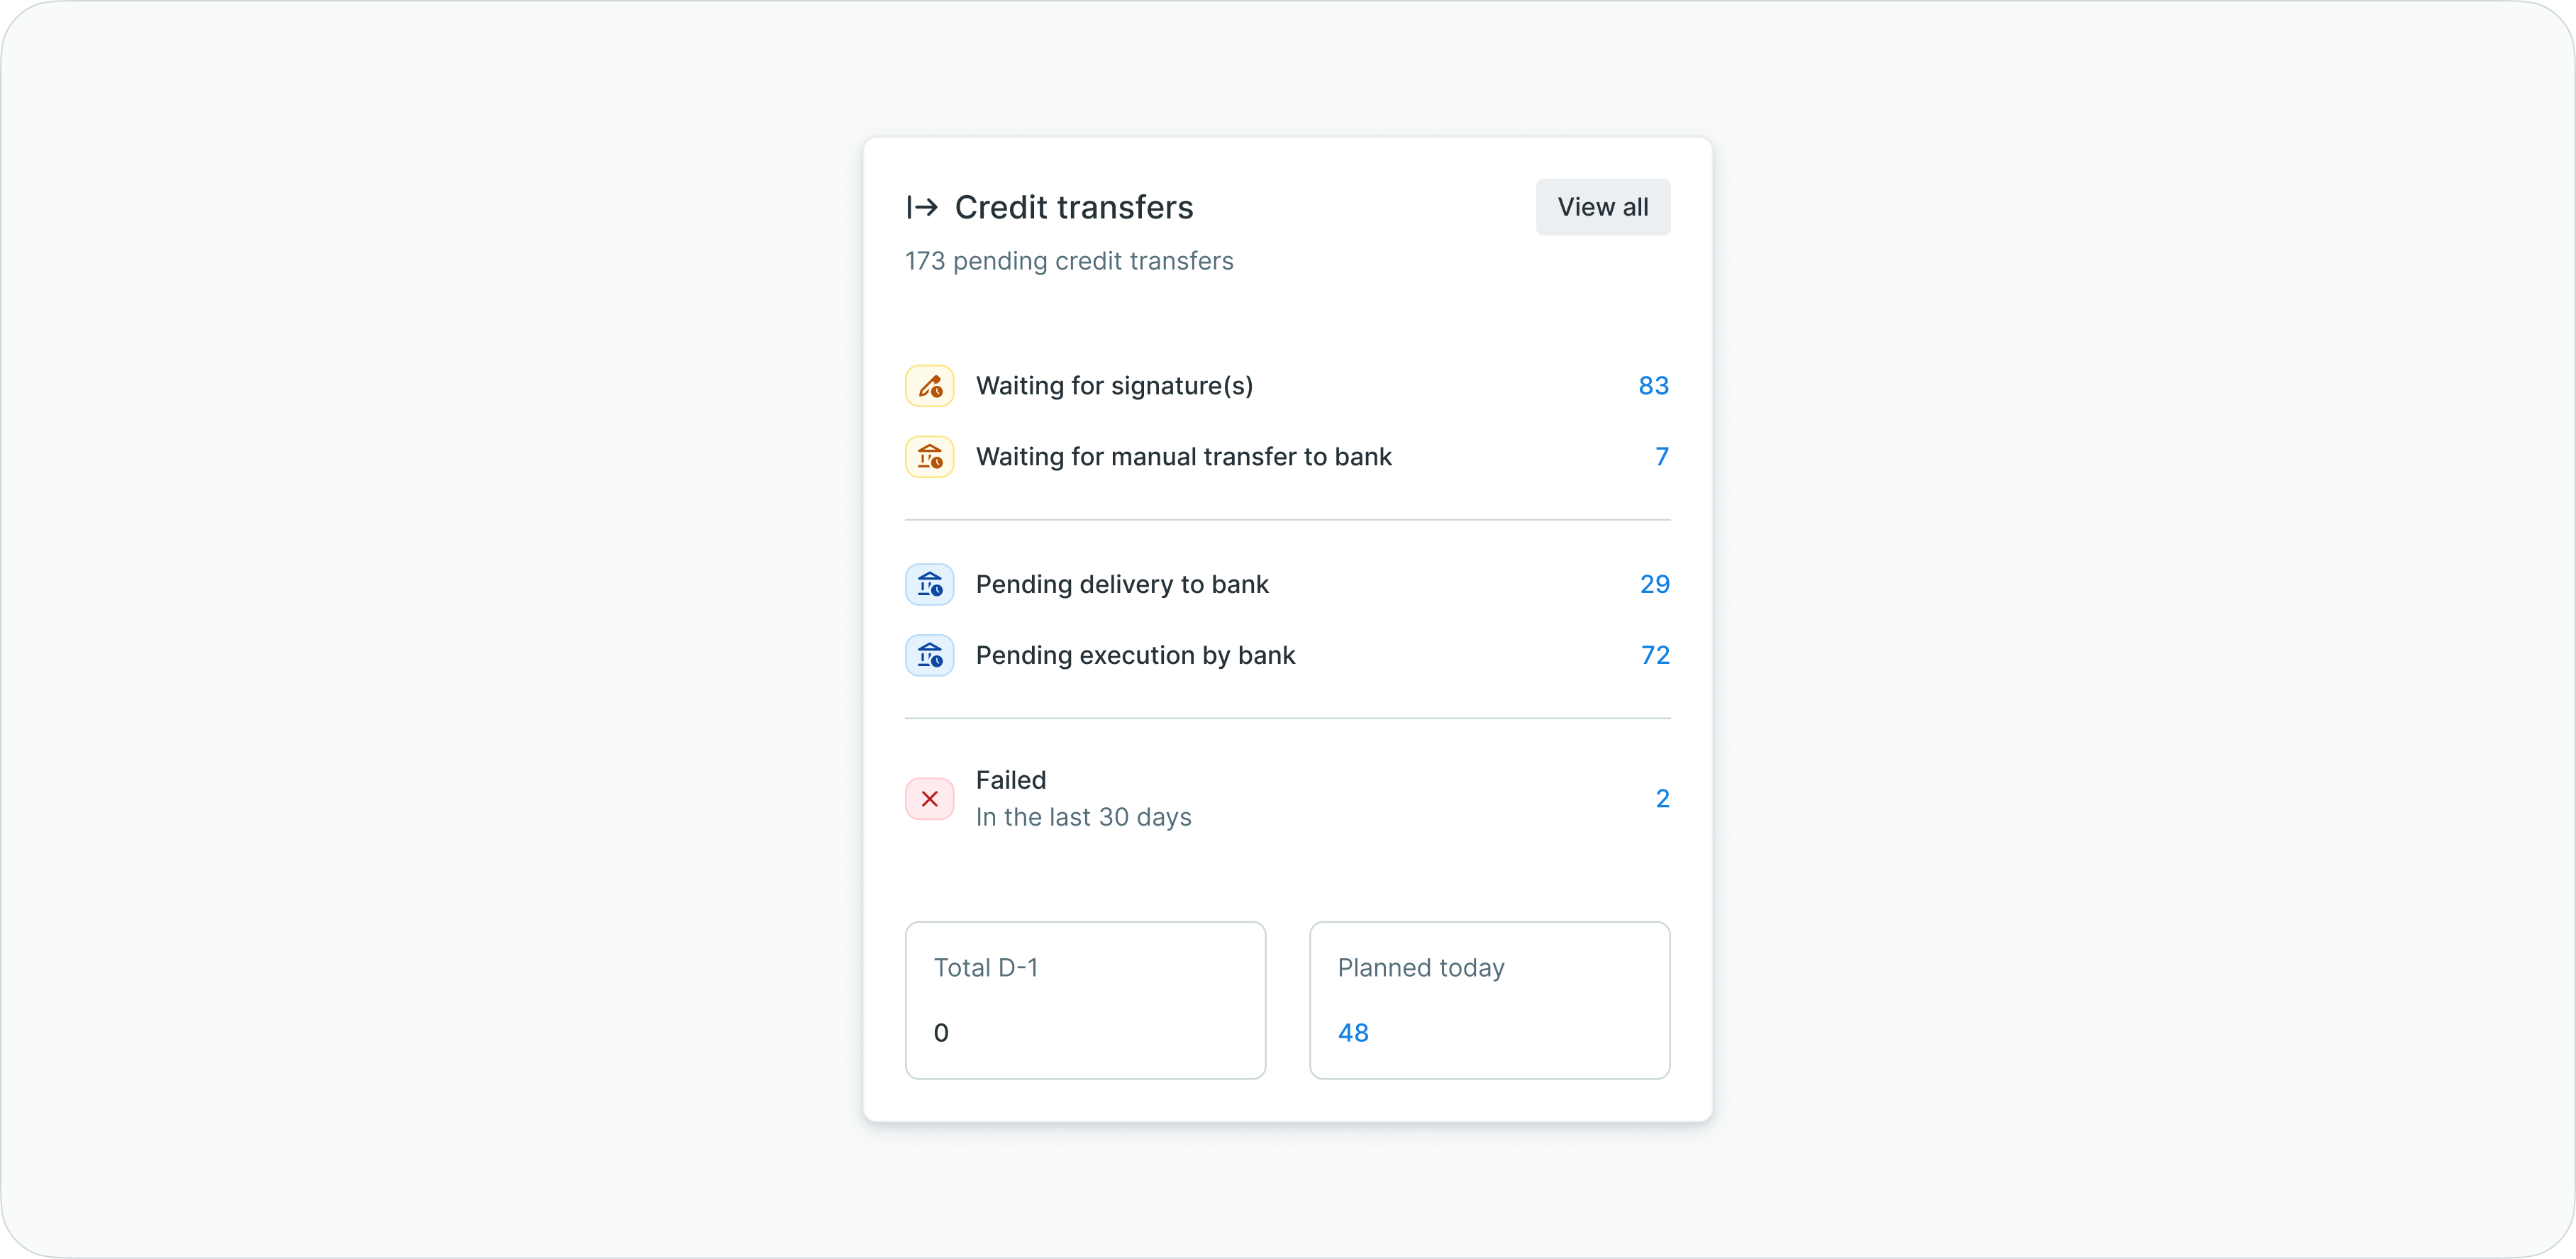
Credit transfers widget
Interactive navigation
All status counters are clickable and redirect to a pre-filtered credit transfers list showing only payments in that specific status. The View all button provides access to the complete credit transfers page.
Related functionalityFor detailed payment management, creation, and approval workflows, see Outgoing Payments - Creating and managing credit transfers and standing orders.
Counterparties widget
The counterparties widget displays an overview of counterparty statuses, showing how many beneficiaries are active, pending approval, or flagged for compliance review.
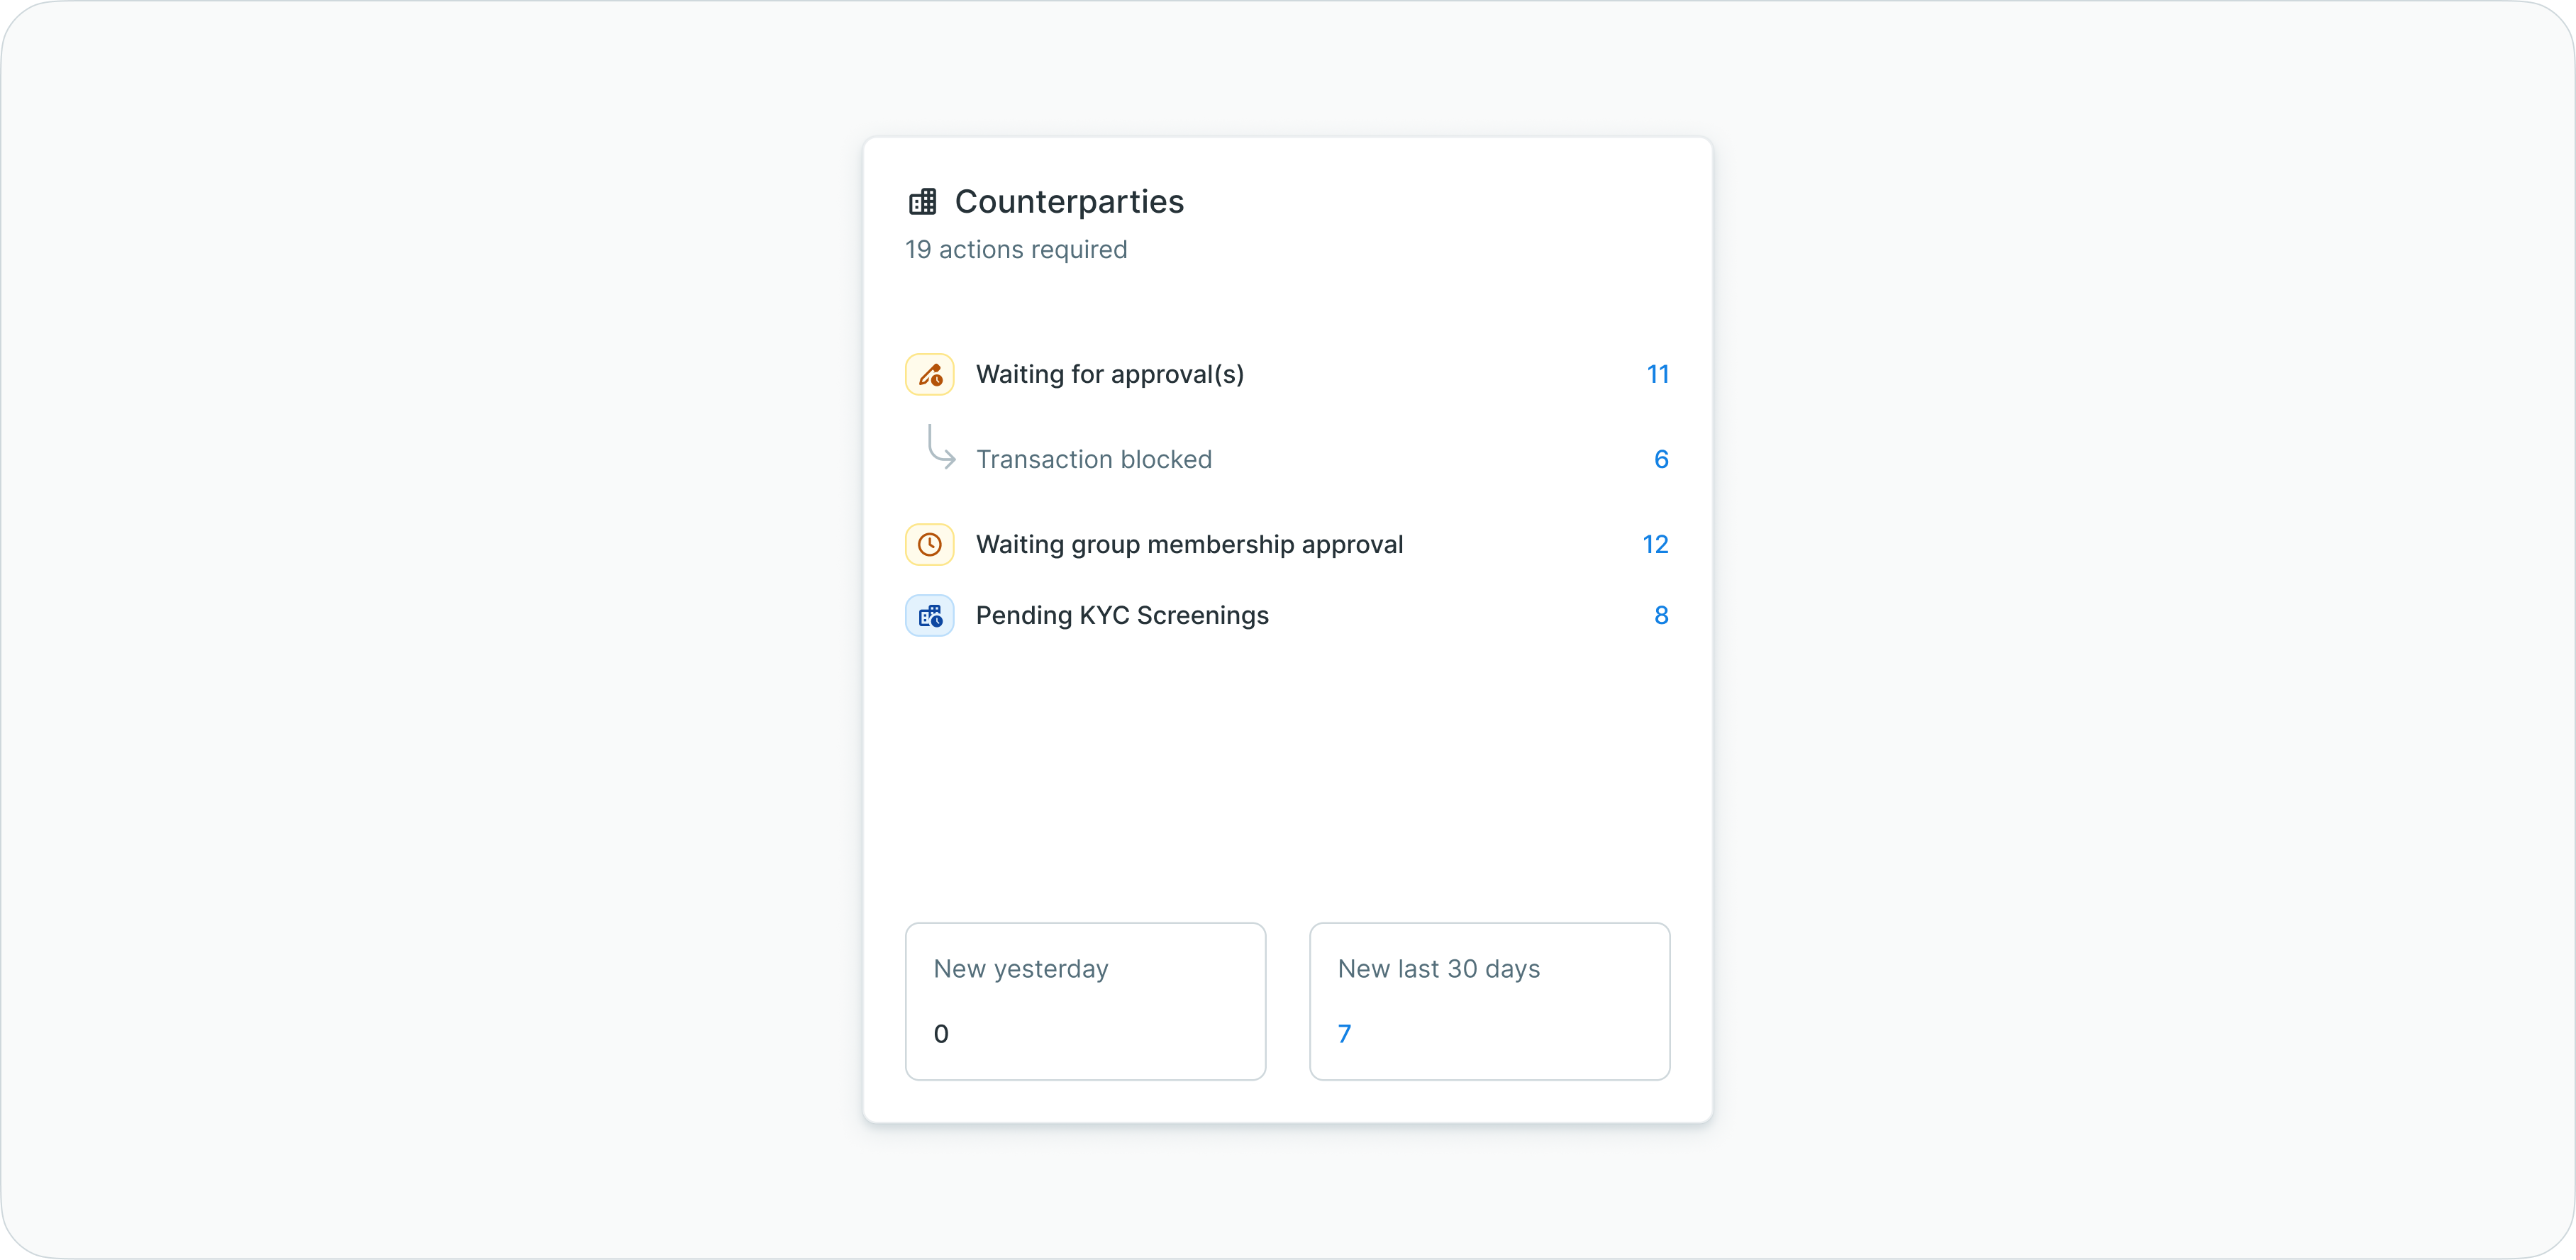
Counterparties widget
All status counters are clickable and redirect to a pre-filtered counterparties list for immediate action on pending approvals or compliance issues.
Related functionalityFor counterparty management, approval processes, and compliance workflows, see Counterparties - Investor and beneficiary management.
Top transactions overview
A curated list displaying the 10 highest-value transactions based on yesterday's requested execution date (D-1), showing the most relevant payment information at a glance.
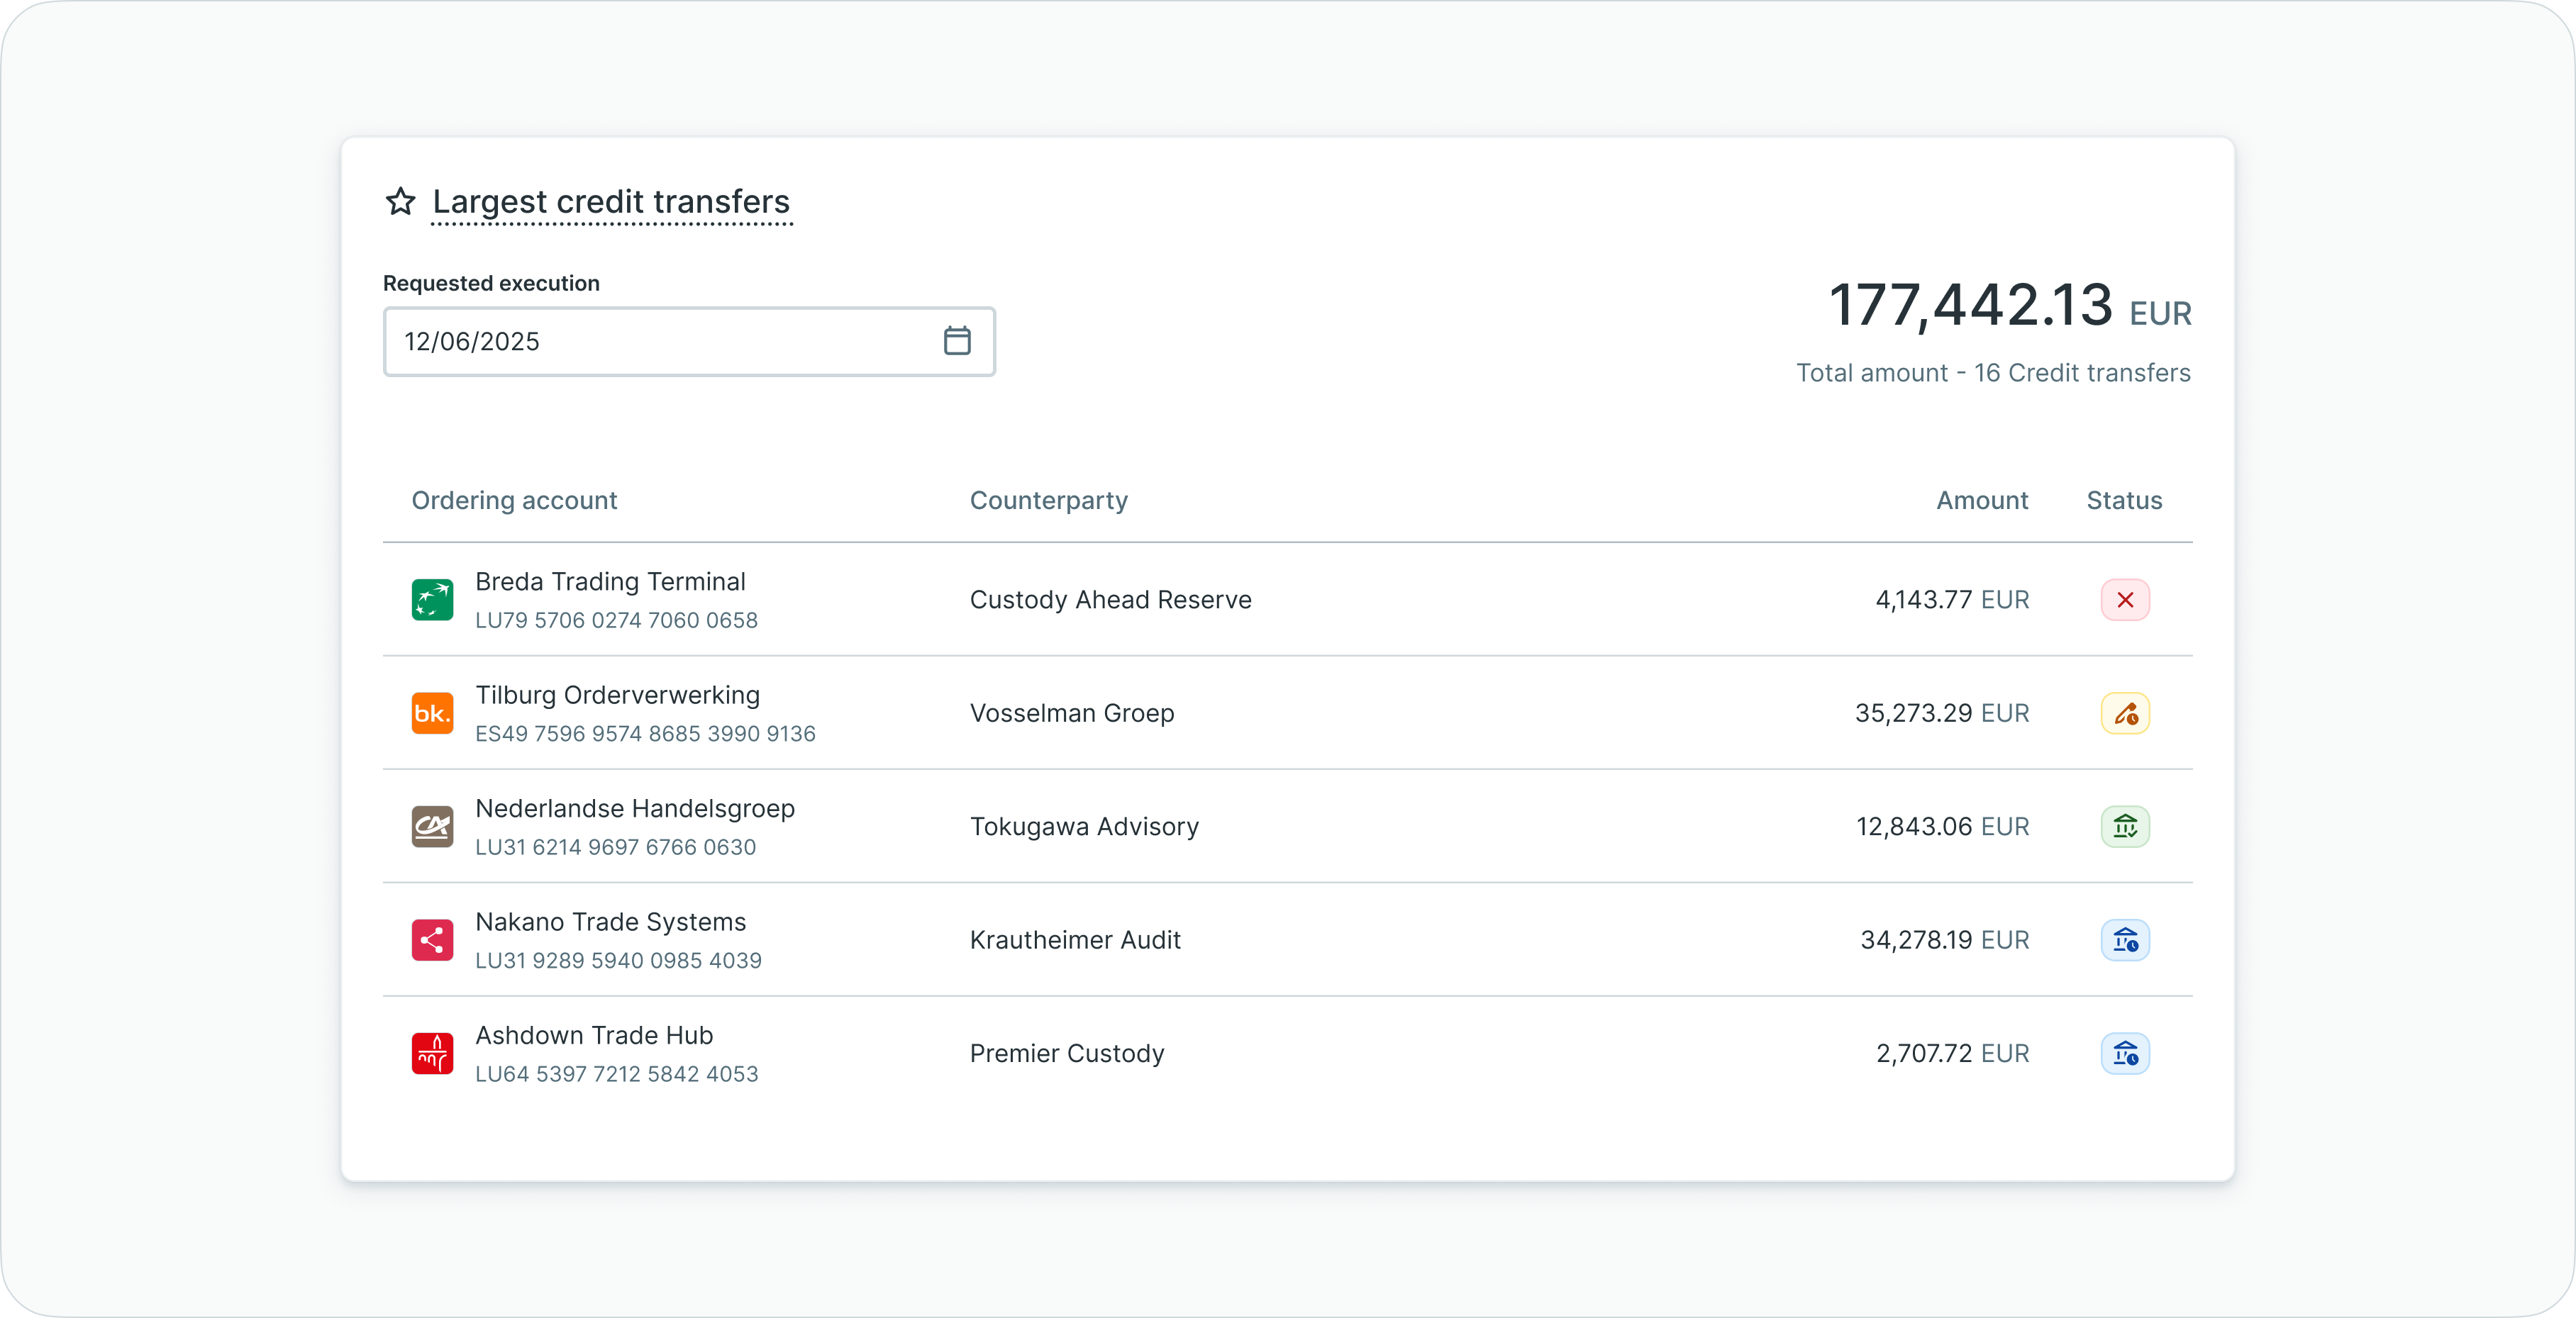
Top transactions overview widget
Information displayed
Each transaction shows:
- Ordering party account
- Counterparty account
- Amount (with applied exchange rate)
- Transaction status
Users can change the displayed value date and navigate directly to individual payment details by clicking on a transaction.
Overdue credit transfers
A cumulative bar chart displays overdue credit transfers by requested execution date, showing total amounts in EUR with applied exchange rates. The chart includes only payments in statuses prior to 'Executed'.
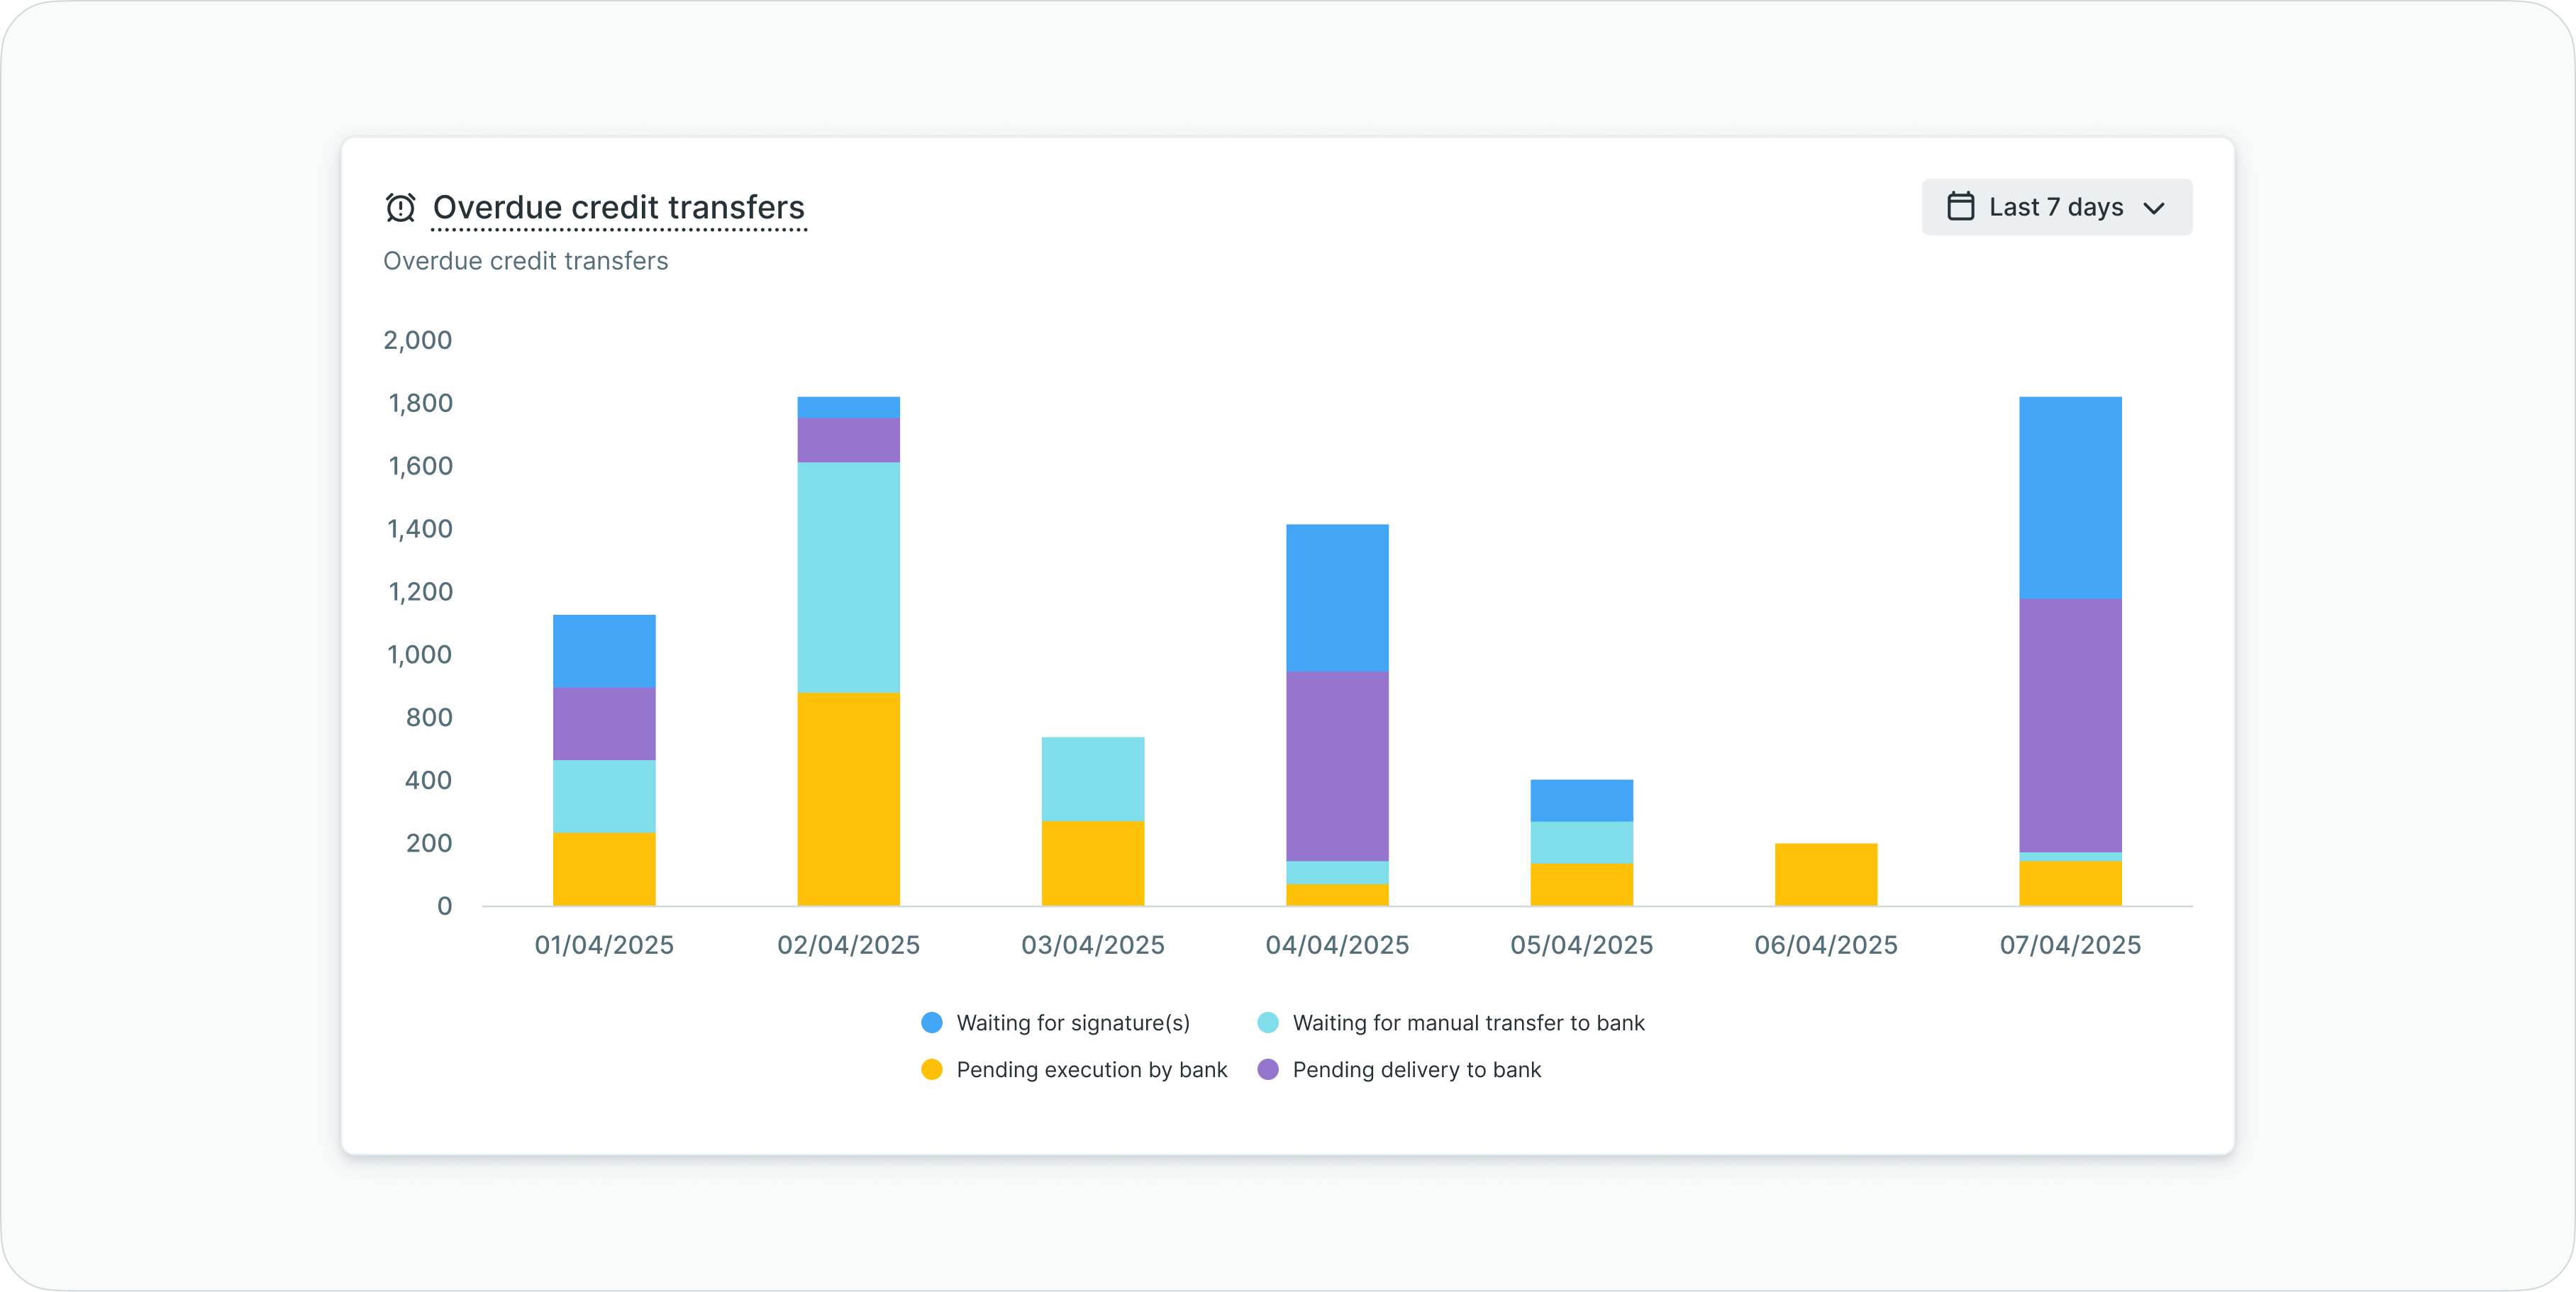
Overdue credit transfers widget
Time range customization
Users can adjust the time range by selecting between the last 3, 7, 15, or 30 days to analyze overdue payment patterns over different periods.

Time range selector
Clicking on any bar redirects to a pre-filtered credit transfers list showing payments overdue for that specific date.
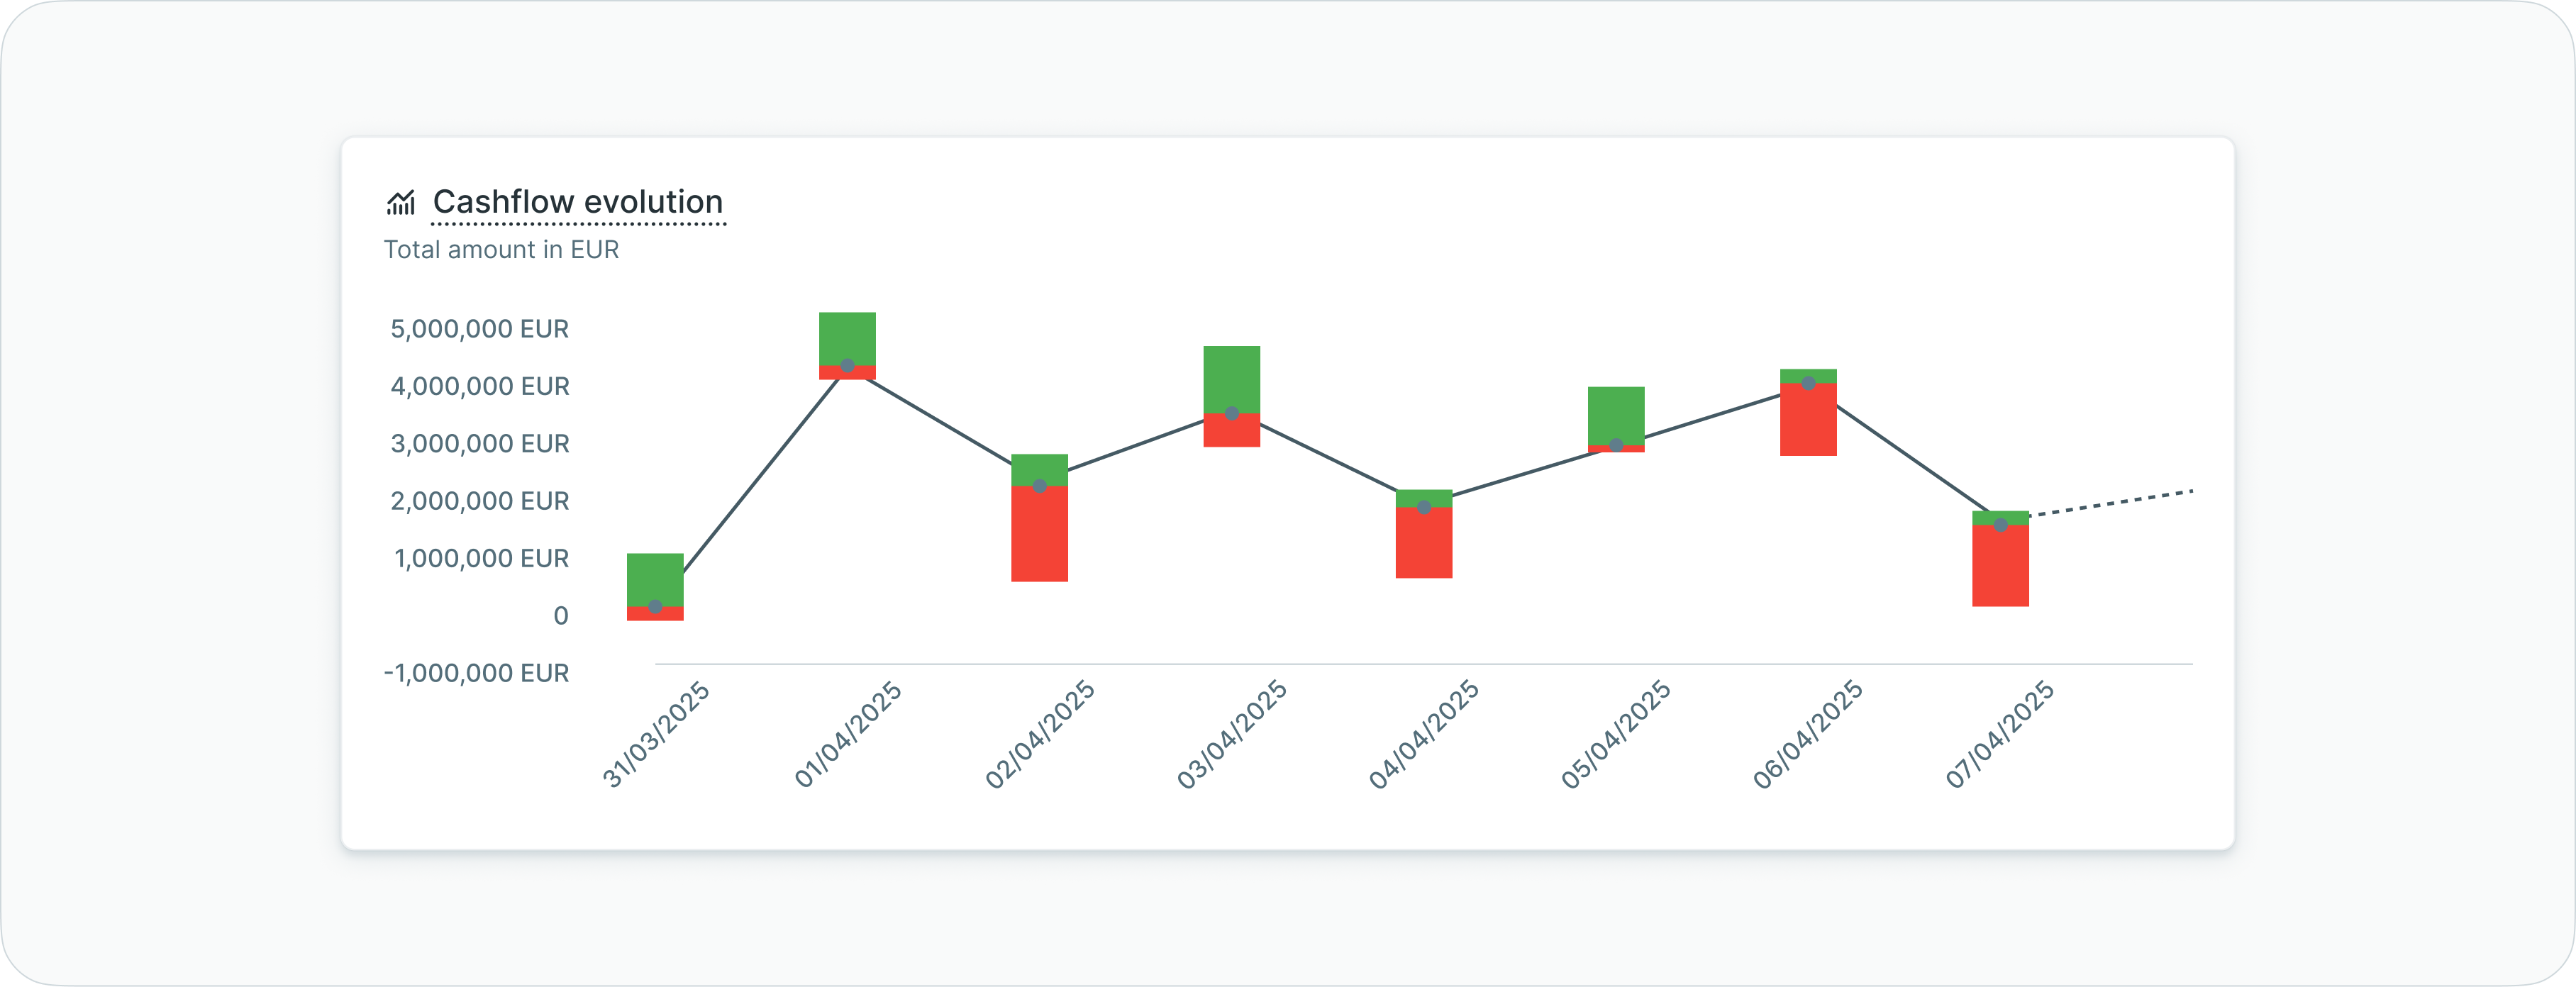
Cashflow evolution
An interactive chart displaying cashflow evolution and future forecasting for a selected ordering party account. The chart visualizes historical transactions from bank statements and forecasts future cashflow based on planned payments in LYNKS.
Cashflow evolution widget
Chart components
The chart displays:
| Element | Description |
|---|---|
| Green bars | Incoming transactions (credits) from bank statements for that day |
| Red bars | Outgoing transactions (debits) from bank statements for that day |
| Line | Closing balance of that day from bank statements (MT940 or CAMT.053) |
| Black vertical line | Today's date marker |
Time periods displayed
The chart shows:
- 30 calendar days before today - Historical data from bank statements (weekends not displayed)
- Today - Expected execution transactions with today's requested execution date or ASAP status
- 7 calendar days after today - Forecasted transactions based on planned payments (weekends not displayed)
Account selection
In the top right corner, users can select which ordering party account to display. The dropdown shows only accounts for which the user has access rights.

Account selector
The widget defaults to displaying the most frequently used account based on transaction volume over the last 7 days.
Transaction data sources
| Time Period | Data Source |
|---|---|
| Past (before today) | Historical transactions from bank statements (MT940/CAMT.053) |
| Today | Transactions with expected execution date = today or ASAP, statuses: Draft, Waiting for signature(s), Waiting for manual transfer to bank, Pending delivery to bank, Pending execution by bank, and Executed |
| Future (after today) | Planned transactions from LYNKS with future execution dates in non-final statuses |
Tooltip information
Hovering over any bar displays detailed information:
- Date (dd/mm/yyyy)
- Incoming: amount in account currency (transaction count)
- Outgoing: amount in account currency (transaction count)
- Balance: closing balance in account currency
Multi-currency handlingFor future transactions in currencies different from the ordering account currency, the system applies the most recent available ECB exchange rate for conversion.
Cashflow forecastingThe cashflow evolution widget functions as a cash prediction tool. Future transaction amounts include all planned payments regardless of your permission scoping, providing an accurate forecast of account positions. Transaction counters are not clickable for forecasted periods.
Currency conversion
All financial amounts on the Dashboard are displayed in the tenant's default currency. The symbol (≈) behind the currency indicates that an ECB exchange rate has been applied for conversion.
Exchange rate source
LYNKS fetches exchange rates daily from the European Central Bank (ECB), ensuring accurate and up-to-date conversions for multi-currency positions.
Related functionalityFor information about currency configuration and exchange rate management, see Transaction Currencies - Multi-currency handling and exchange rates.
Best practices
Follow these recommendations to maximize the value of your Dashboard:
- Review daily - Check the Dashboard each morning to understand your current financial position and pending actions
- Use filters strategically - Apply account group filters to focus on specific business units or responsibility areas
- Monitor overdue payments - Address overdue credit transfers promptly to maintain payment schedules
- Leverage cashflow forecasting - Use the cashflow evolution widget to anticipate liquidity needs and plan funding
- Track counterparty approvals - Monitor pending counterparties to avoid payment delays due to unapproved beneficiaries
- Analyze trends - Adjust time range filters on charts to identify patterns in payment volumes and timing
Related documentation
Explore related sections for more information:
- Platform Navigation - Detailed guide to the head-up display, table views, filters, and search functionality - Tables, filters, and view customization
- Permissions - Comprehensive explanation of access control and role-based permissions - Understanding access control and data scoping
- Action Center - Centralized task and approval management - Managing pending approvals and tasks
- Bank Accounts - Account management, balance monitoring, and transaction history - Account balances and transaction history
- Outgoing Payments - Creating and managing credit transfers and standing orders - Credit transfers and payment management
- Counterparties - Investor and beneficiary management - Counterparty management and approvals
- Transaction Currencies - Multi-currency handling and exchange rates - Currency configuration and ECB rates
Support
For assistance with Dashboard features or questions about financial data display, contact [email protected].
Updated 3 months ago